The research was already honest. The PDF was what nobody finished.
Scroll: night into first light — the report's own metaphor.
overview
"Gorg-o-meesh" is the Persian word for twilight — the hour when you cannot yet tell a wolf from a sheep. IranBroker named its annual exchange report after it, because that is the state of the Iranian crypto market: no regulator, no proof-of-reserves, and no reliable way for an ordinary person to tell a safe exchange from a dangerous one.
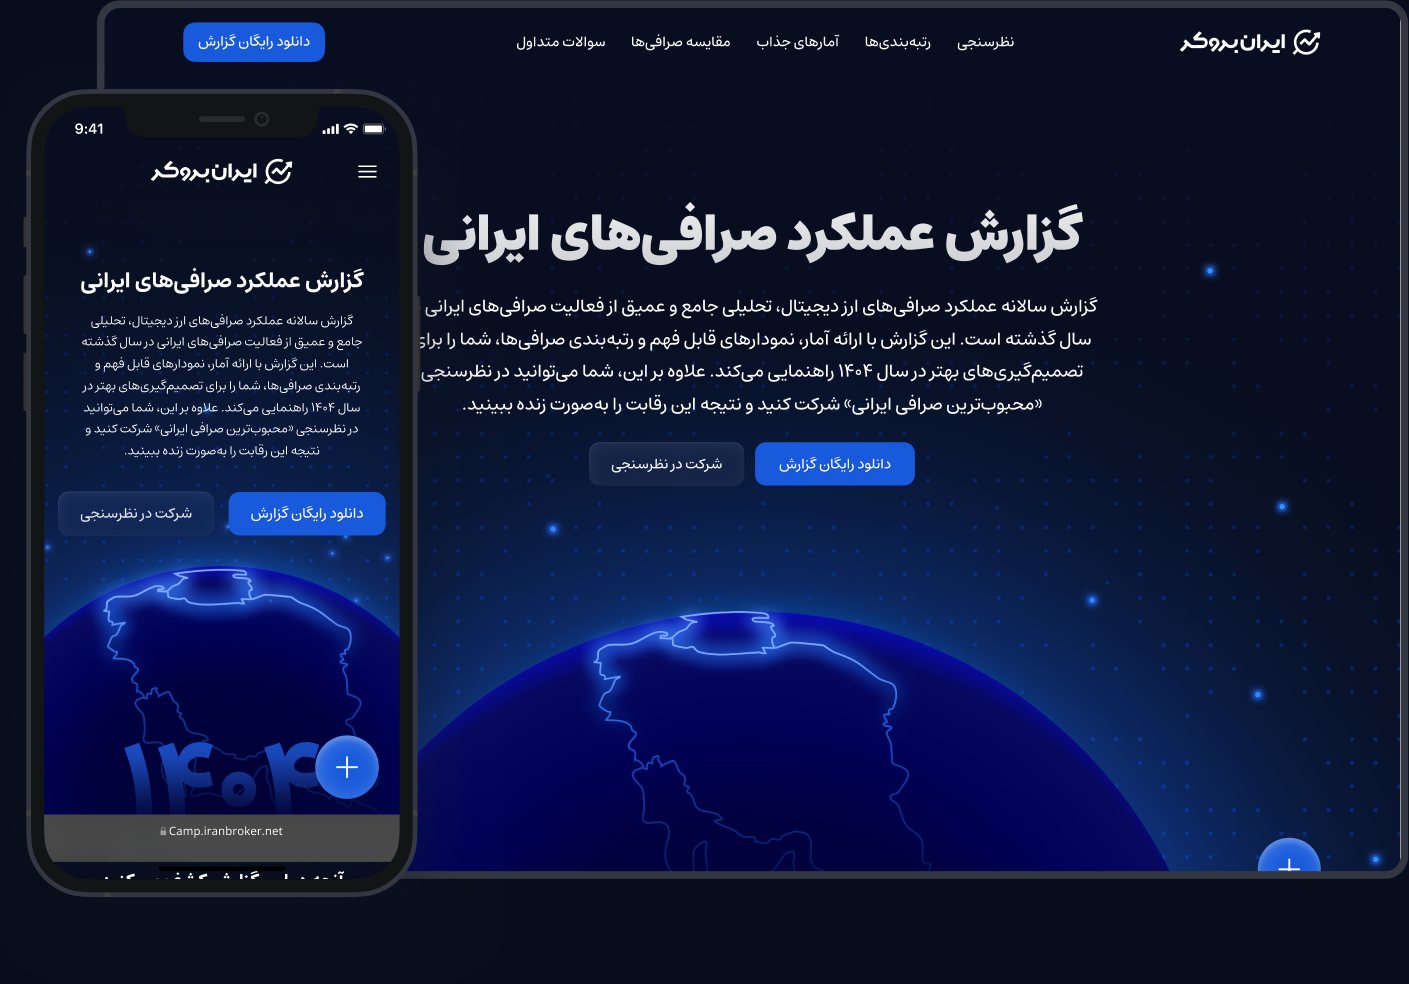
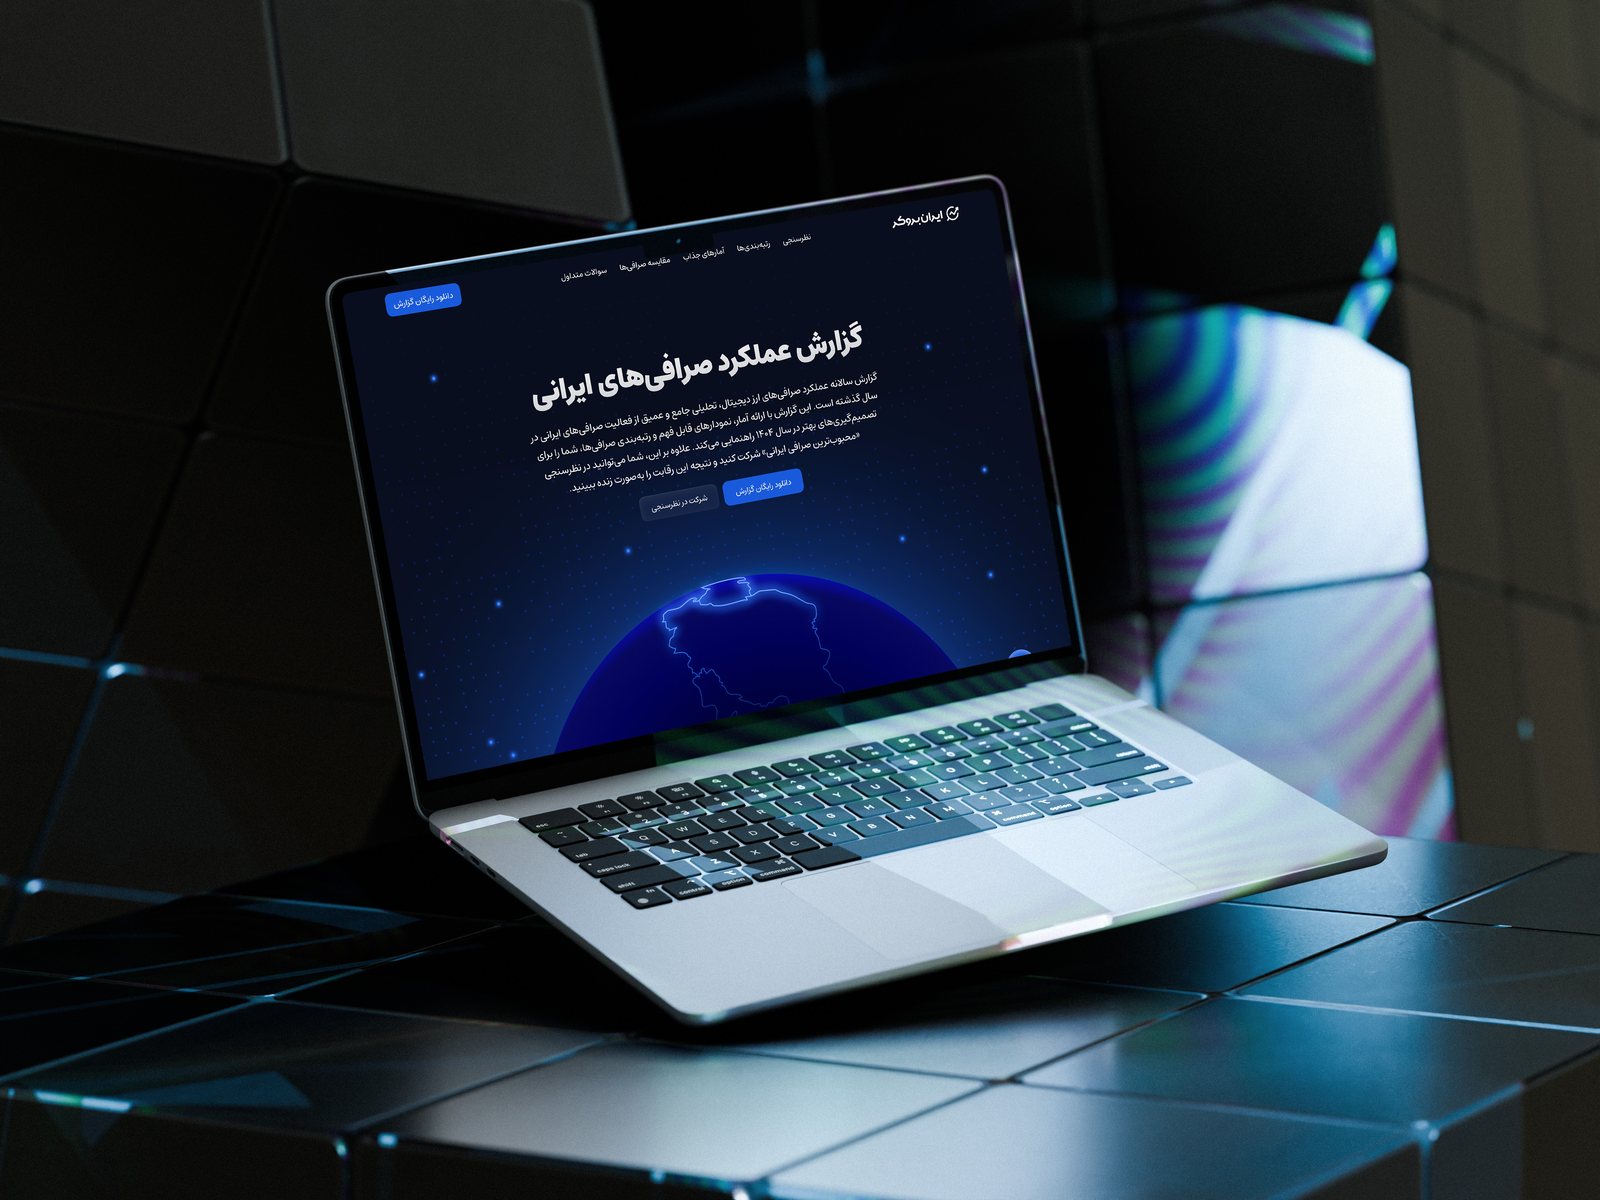
The report ranked every major Iranian exchange across 100 indicators. My job was not the research — it was the product around it: a campaign page where the findings could be scanned, compared, questioned and voted on. It is live at camp.iranbroker.net, and the full case study is downloadable below.
The problem
A PDF asks for a decision before it gives you anything. Download it, open it, scroll it, and find your own answer. In a market this opaque, that is the wrong first ask — the people who need the report most are exactly the people least equipped to mine it.
The previous edition proved the appetite was real. What it never had was a surface where the findings could be used: no way to compare two exchanges, no way to ask a question, nothing to do but read.
What I found
A ten-question survey across three segments said the demand was not the issue: 67% called a report like this "very important" and actively looked for it. The format expectations were what split — 55% wanted a comparison table, 42% wanted charts, and only 30% asked for the PDF itself.
The interviews explained why. Beginners distrusted Telegram threads but could not parse "KYC" or "cold wallet", and read visual summaries far more readily than prose. Professionals wanted sortable comparison and a visible methodology, and skipped any interface that hid its numbers. Different words, one instruction from every segment: be unbiased, and show your work.
What three user segments told us
What I designed
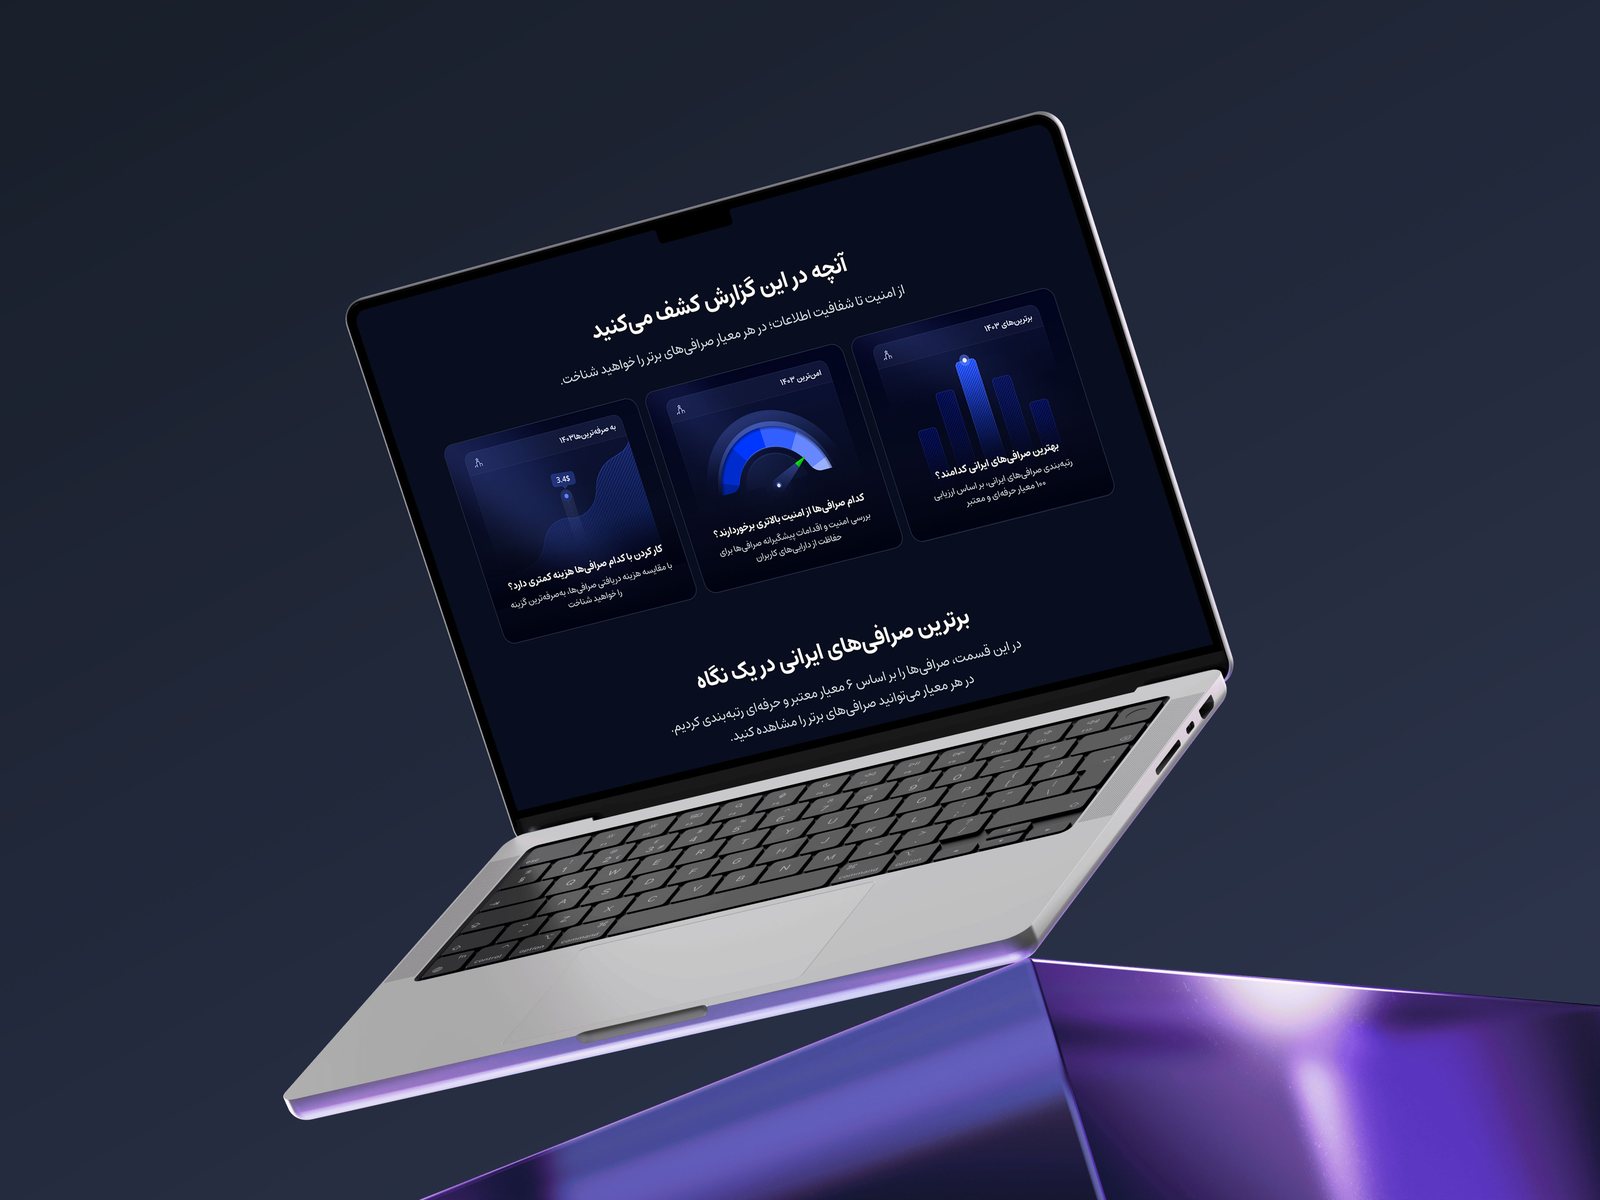
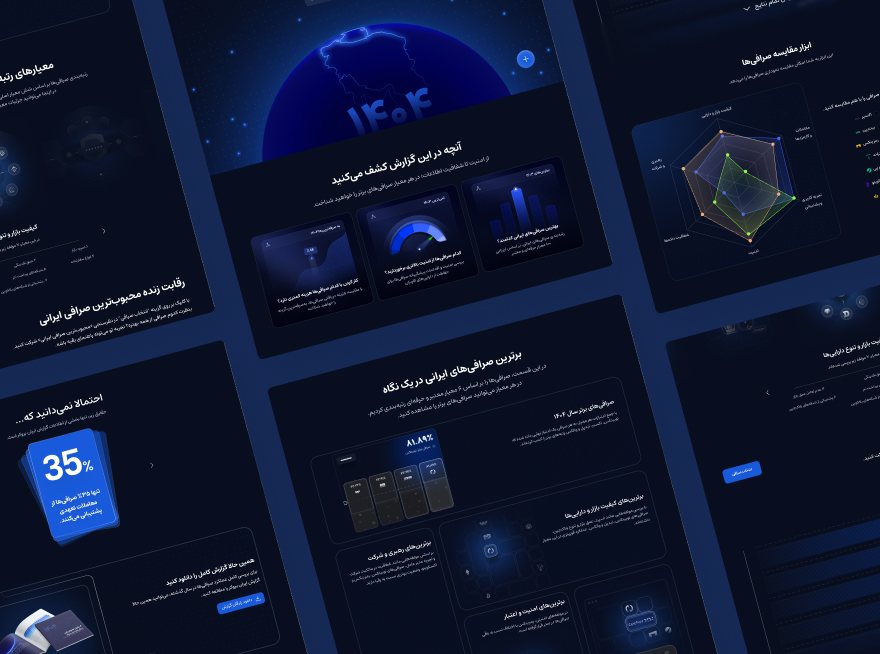
I built the page as a preview, not a download gate. Key findings and comparisons sit above the form, so the value arrives before the ask does — enough to make the full report worth wanting.
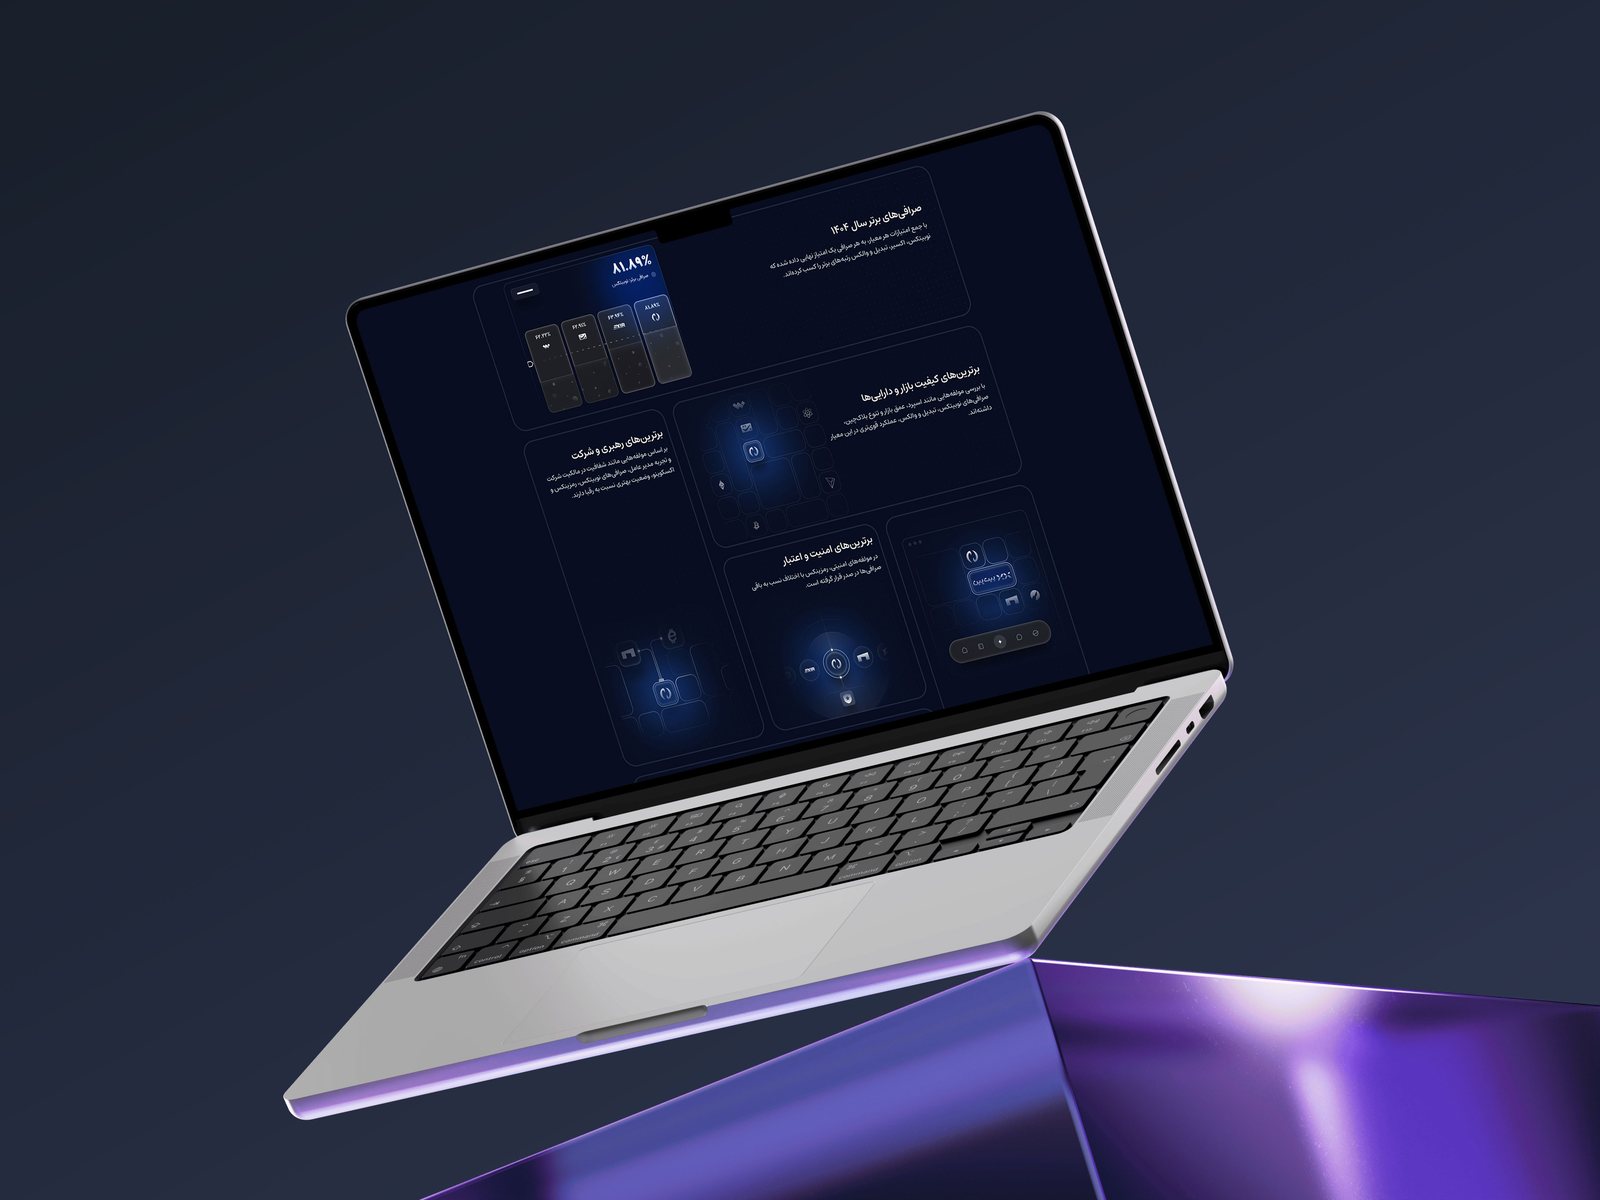
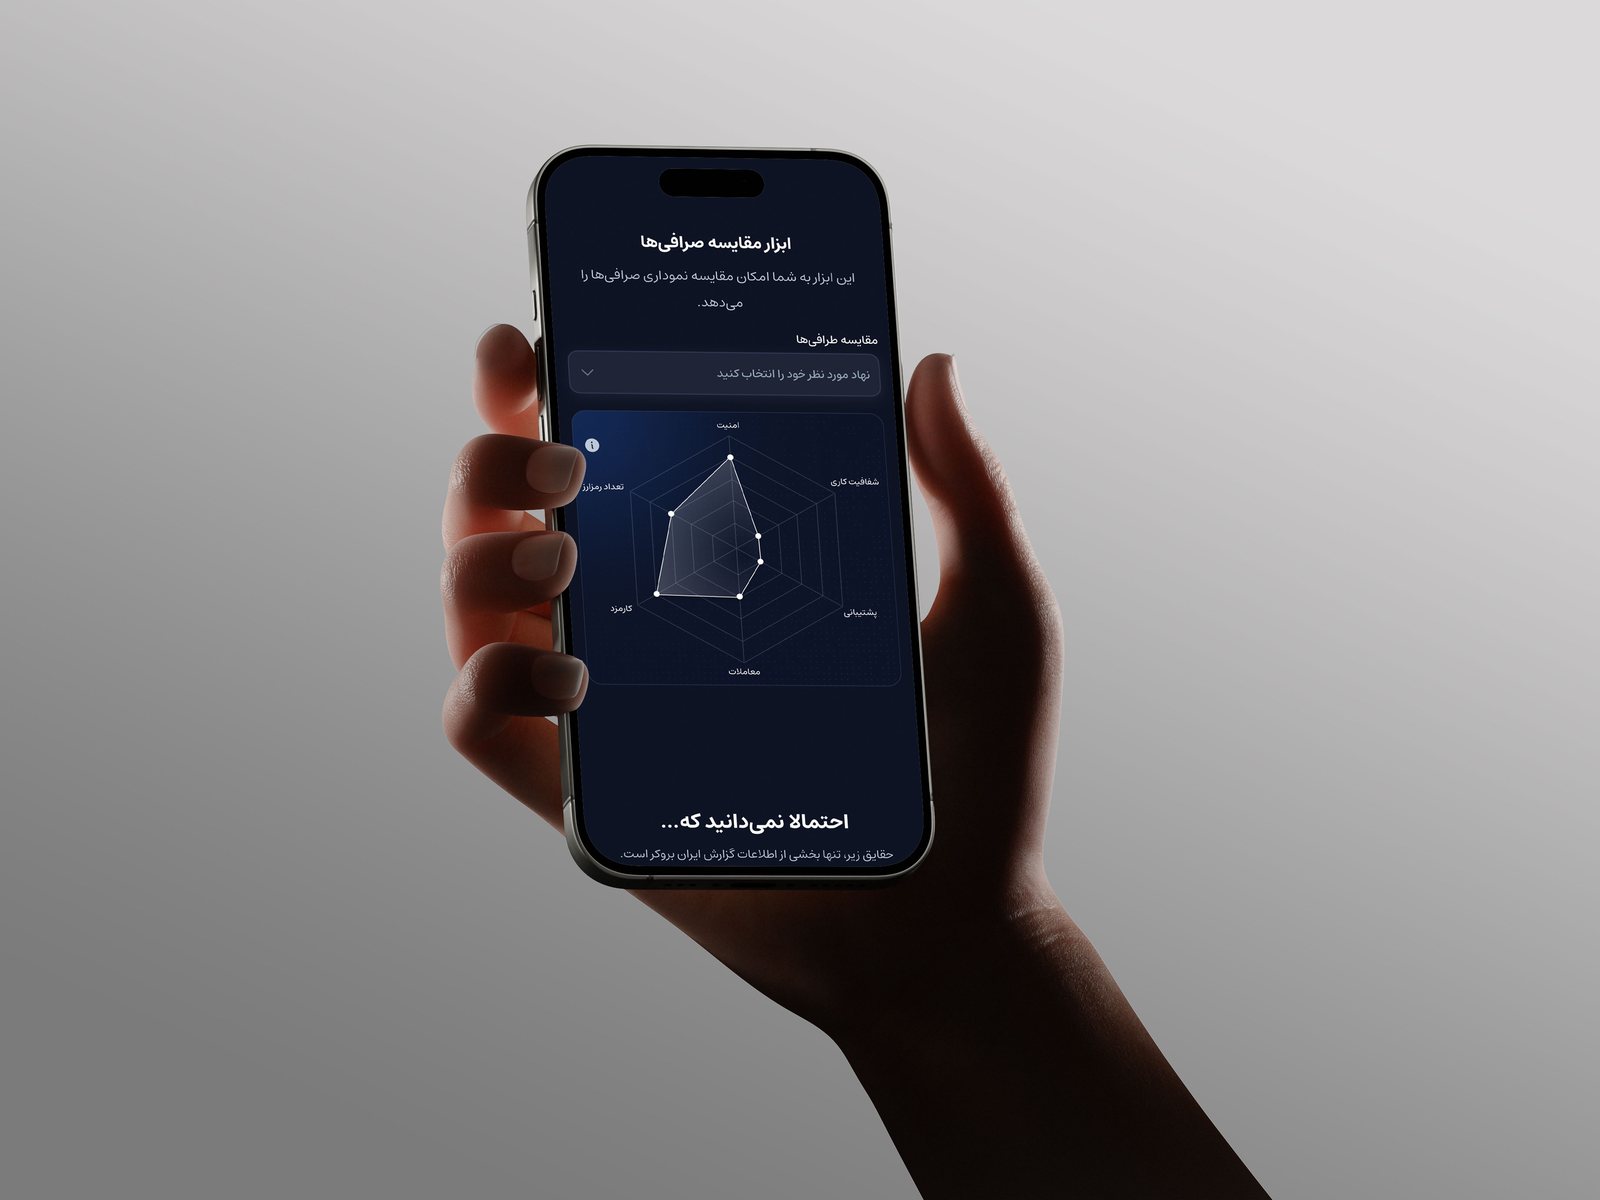
The scoring framework is exposed rather than asserted: six criteria, 100 indicators, each explained in plain language beside the score. A comparison tool puts up to four exchanges on the same axes. A live vote turned the page from something you read into something you participate in. And a floating action button keeps all four reasons people came — compare, vote, ask, download — reachable at any scroll position, because a campaign page is scrolled, not navigated.
The chatbot is a RAG agent over the report itself, so "which exchange charges the lowest trading fee" is answered from the document rather than from the model's imagination.
The most-loved-exchange vote
0 people voted
- 01Nobitex0
- 02Wallex0
- 03Exir0
- 04Tabdeal0
Votes were counted server-side and broadcast over WebSocket, so the ranking moved while you watched. These are the numbers from the campaign period.
Outcome
The campaign is live at camp.iranbroker.net. The vote alone drew 15,984 participants — the clearest sign the page stopped being a document and became a place.
- preview before the askthe core decisionfindings and comparisons sit above the download form, not behind it
- 15,984 voteslive participationthe most-loved-exchange poll, counted server-side and ranked in real time
- download + valid votethe north-star metricshare of sessions where a visitor both took the report and cast a vote — the honest test of whether the interaction earned its place
The chatbot taught me the most expensive lesson. Three ways of feeding it the report's tables were tested: raw extraction, markdown tables, and one full sentence per table row. Only the third produced answers a sceptical user could trust, and it was by far the slowest to prepare. I had filed retrieval quality under engineering; it was content design, and I should have owned it from day one.
Six criteria, one hundred indicators
Every metric was explained next to its score, so the ranking could be argued with rather than believed. The highest total in the report was 81.89%.